Reading the trend and score factors
The number alone is not the whole story. REHL shows you where the score has been and which signals built it.
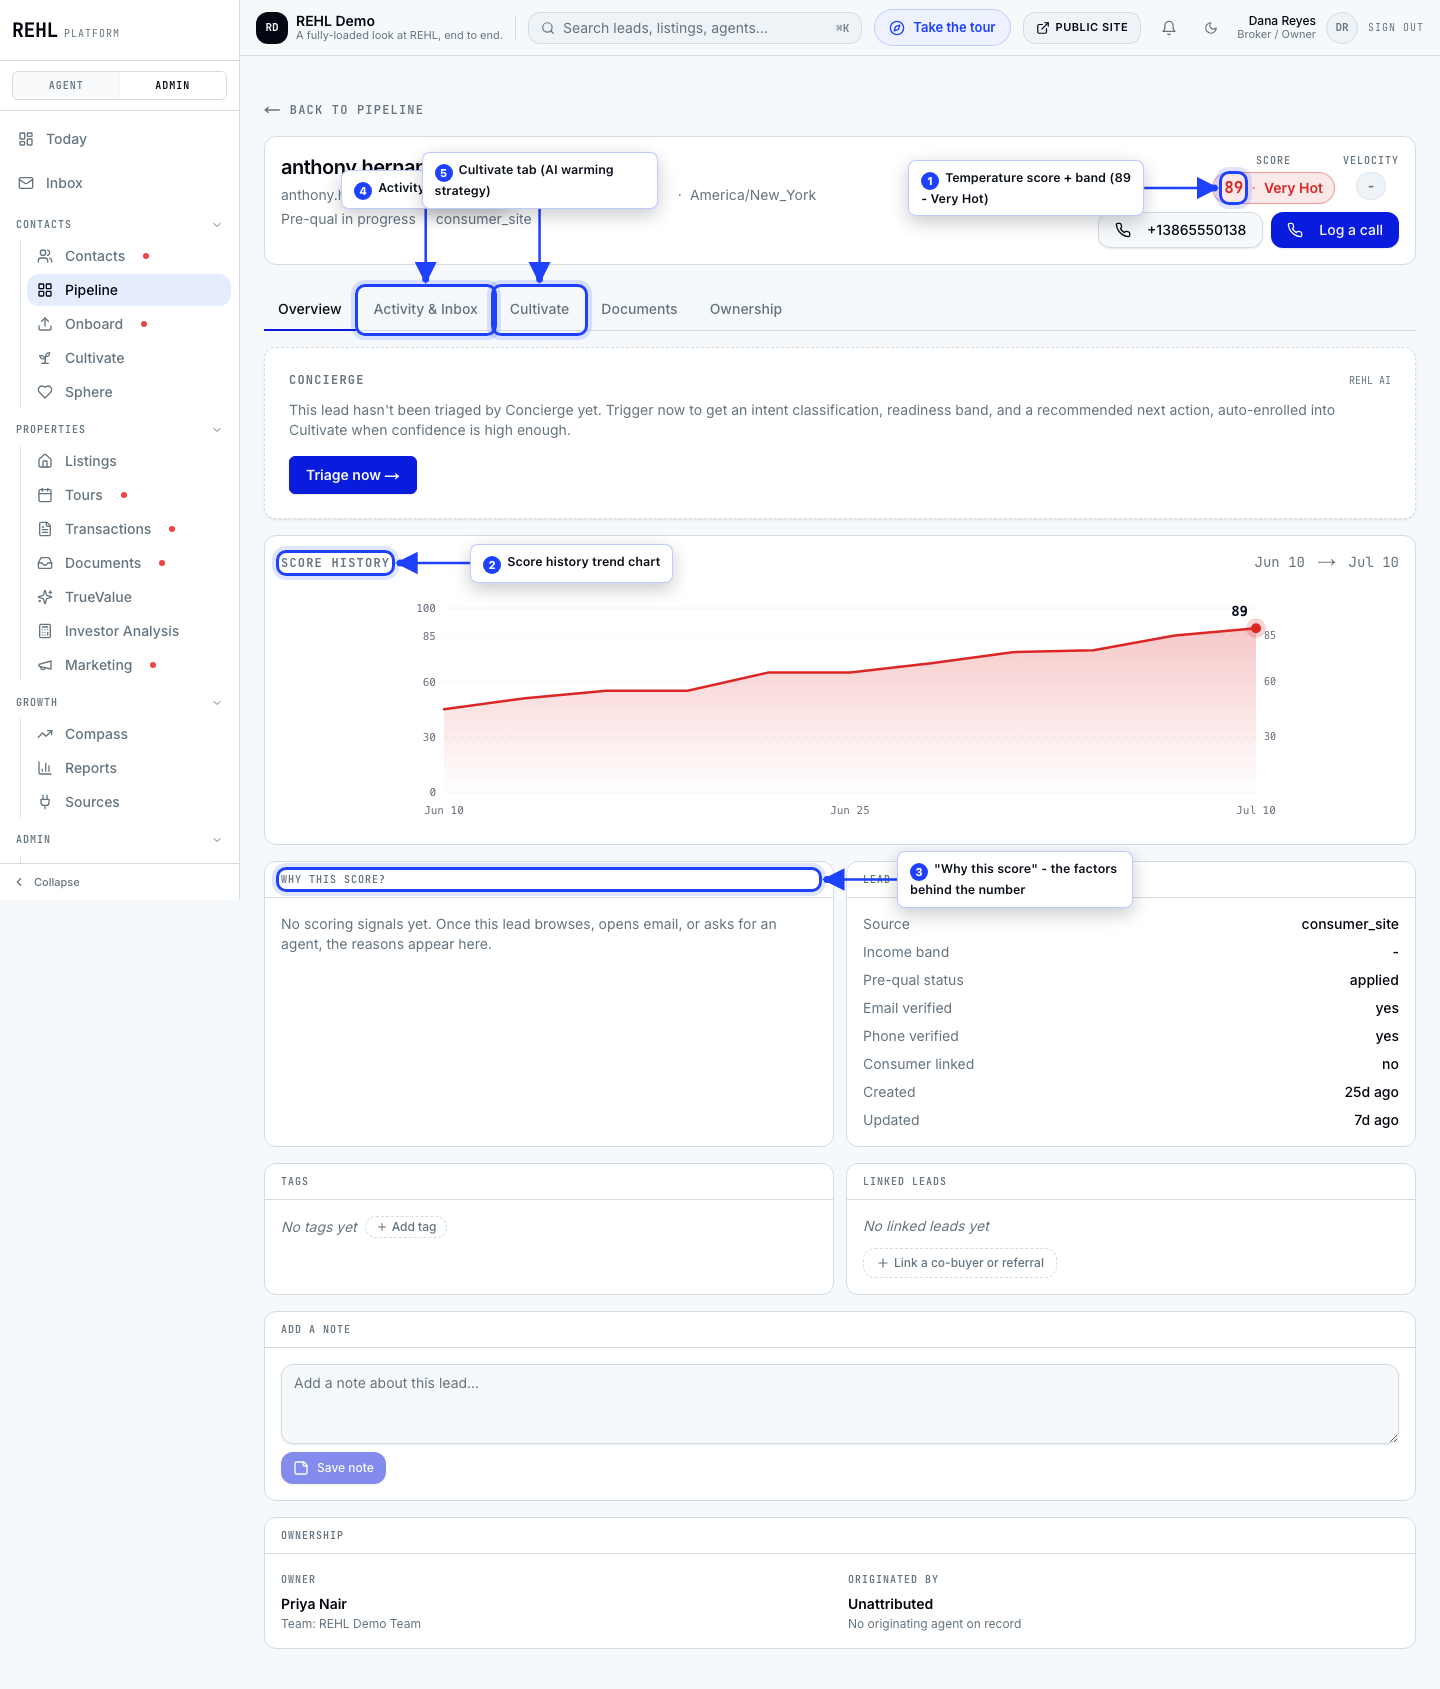
Score history
Open a lead and the score history chart plots every recalculation over time against the four band cutoffs. In the pipeline list each lead carries the same history as a small sparkline, so you can spot a climber without opening anything.
This is a real recorded history, not an estimate. Every score change is written down when it happens, including the band it moved from and to.
Why this score?
The card under the chart translates the stored factors into plain English with each one's contribution, for example "Requested an agent match (+24)". Anything that subtracted reads as a subtraction. It is the fastest way to learn what a lead actually cares about before you pick up the phone.
The factors list is written at the same moment as the score, so it explains the calculation that produced the current number rather than being worked out again when you open the page.
Need more help? Contact support.